> ## Documentation Index
> Fetch the complete documentation index at: https://docs.pipecat.ai/llms.txt
> Use this file to discover all available pages before exploring further.
# MLflow
> Trace and analyze Pipecat voice agent conversations with MLflow
## Overview
[MLflow](https://mlflow.org/) is an [open-source](https://github.com/mlflow/mlflow) platform for managing the end-to-end machine learning and AI lifecycle. MLflow Tracing provides detailed observability into AI agent execution, capturing LLM calls, tool usage, and agent decisions with a rich visualization UI.
Since Pipecat's built-in tracing uses [OpenTelemetry](/api-reference/server/utilities/opentelemetry), you can send traces directly to MLflow's OTLP endpoint for visualization and analysis.
Learn about MLflow's tracing capabilities
MLflow's guide for tracing Pipecat applications
Browse the MLflow open-source repository
Explore the MLflow platform
## Installation
Install Pipecat with tracing support and the OTLP HTTP exporter:
```bash theme={null}
uv add "pipecat-ai[tracing]" mlflow opentelemetry-exporter-otlp-proto-http
```
## Prerequisites
### Start MLflow
The quickest way to start the MLflow tracking server is with `uvx` (no installation needed):
```bash theme={null}
uvx mlflow server --port 5000
```
The MLflow UI will be available at [http://localhost:5000](http://localhost:5000).
For other setup options including Docker and pip, see the [MLflow environment setup guide](https://mlflow.org/docs/latest/genai/getting-started/connect-environment/).
If you prefer a managed solution, [Managed MLflow](https://mlflow.org/docs/latest/genai/getting-started/databricks-trial/) on AWS SageMaker or Databricks provides a fully hosted MLflow experience with no infrastructure to manage.
### Key Features
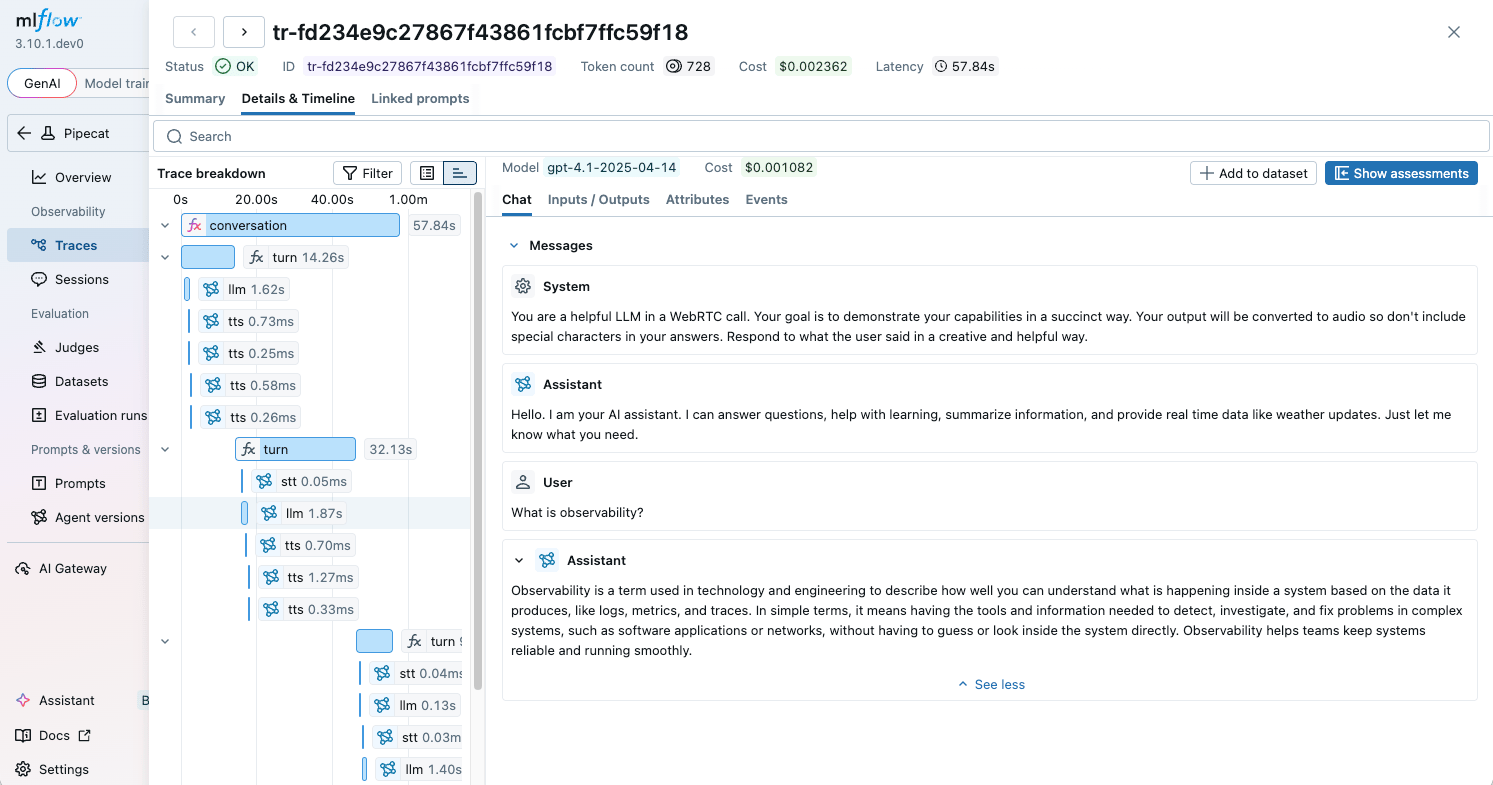
* **Trace visualization**: Inspect every LLM call, STT/TTS operation, and conversation turn in a hierarchical trace view
* **Token usage tracking**: Monitor input/output token counts across conversations
* **Performance metrics**: Track TTFB, processing duration, and latency for each service
* **Evaluation framework**: Evaluate agent outputs using built-in LLM judges and custom scorers
* **Open source**: Fully open-source with no vendor lock-in, self-host anywhere
## Configuration
Configure the OTLP HTTP exporter to send traces to MLflow:
```python theme={null}
import os
from opentelemetry.exporter.otlp.proto.http.trace_exporter import OTLPSpanExporter
from pipecat.utils.tracing.setup import setup_tracing
exporter = OTLPSpanExporter(
endpoint=os.getenv("OTEL_EXPORTER_OTLP_ENDPOINT", "http://localhost:5000/v1/traces"),
)
setup_tracing(
service_name="my-pipecat-bot",
exporter=exporter,
)
```
Alternatively, configure with environment variables:
```bash theme={null}
export OTEL_EXPORTER_OTLP_ENDPOINT="http://localhost:5000"
export OTEL_EXPORTER_OTLP_HEADERS="x-mlflow-experiment-id=0"
```
The `x-mlflow-experiment-id` header specifies which MLflow experiment to log traces to. Use `0` for the default experiment, or create a dedicated experiment:
```bash theme={null}
mlflow experiments create --experiment-name "pipecat-traces"
# Use the returned experiment ID in the header
```
## Usage
### Basic Setup
```python theme={null}
import os
from dotenv import load_dotenv
from opentelemetry.exporter.otlp.proto.http.trace_exporter import OTLPSpanExporter
from pipecat.audio.vad.silero import SileroVADAnalyzer
from pipecat.pipeline.pipeline import Pipeline
from pipecat.pipeline.worker import PipelineParams, PipelineWorker
from pipecat.processors.aggregators.llm_context import LLMContext
from pipecat.processors.aggregators.llm_response_universal import (
LLMContextAggregatorPair,
LLMUserAggregatorParams,
)
from pipecat.services.cartesia.tts import CartesiaTTSService
from pipecat.services.deepgram.stt import DeepgramSTTService
from pipecat.services.openai.llm import OpenAILLMService
from pipecat.utils.tracing.setup import setup_tracing
from pipecat.workers.runner import WorkerRunner
load_dotenv()
# Initialize tracing with the MLflow exporter
exporter = OTLPSpanExporter(
endpoint=os.getenv("OTEL_EXPORTER_OTLP_ENDPOINT", "http://localhost:5000/v1/traces"),
)
setup_tracing(
service_name="my-pipecat-bot",
exporter=exporter,
)
# Create your services
stt = DeepgramSTTService(api_key=os.environ["DEEPGRAM_API_KEY"])
llm = OpenAILLMService(api_key=os.environ["OPENAI_API_KEY"])
tts = CartesiaTTSService(
api_key=os.environ["CARTESIA_API_KEY"],
settings=CartesiaTTSService.Settings(voice="your-voice-id"),
)
# Create the context and its user/assistant aggregators
context = LLMContext()
user_aggregator, assistant_aggregator = LLMContextAggregatorPair(
context,
user_params=LLMUserAggregatorParams(vad_analyzer=SileroVADAnalyzer()),
)
# Build pipeline
pipeline = Pipeline(
[
transport.input(),
stt,
user_aggregator,
llm,
tts,
transport.output(),
assistant_aggregator,
]
)
# Create the pipeline worker with tracing enabled
worker = PipelineWorker(
pipeline,
params=PipelineParams(
enable_metrics=True,
enable_usage_metrics=True,
),
enable_tracing=True,
enable_turn_tracking=True,
)
# Run the pipeline
runner = WorkerRunner()
await runner.add_workers(worker)
await runner.run()
```
After running your Pipecat application, open the MLflow UI at [http://localhost:5000](http://localhost:5000) and navigate to the **Traces** tab to see detailed traces of your voice agent conversations, including STT, LLM, and TTS spans with latency and token usage.
 ## Troubleshooting
* **No traces visible**: Verify the MLflow server is running and the `OTEL_EXPORTER_OTLP_ENDPOINT` points to the correct address
* **Missing service data**: Ensure `enable_metrics=True` is set in `PipelineParams`
* **Connection errors**: Check that the MLflow server is accessible from your application and the endpoint URL is correct
* **Wrong experiment**: Set the `x-mlflow-experiment-id` header to direct traces to the correct experiment
## References
* [MLflow Tracing Documentation](https://mlflow.org/docs/latest/genai/tracing/)
* [MLflow OpenTelemetry Integration](https://mlflow.org/docs/latest/genai/tracing/app-instrumentation/opentelemetry.html)
* [MLflow Pipecat Integration Guide](https://mlflow.org/docs/latest/genai/tracing/integrations/listing/pipecat.html)
* [Pipecat OpenTelemetry Tracing](/api-reference/server/utilities/opentelemetry)
## Troubleshooting
* **No traces visible**: Verify the MLflow server is running and the `OTEL_EXPORTER_OTLP_ENDPOINT` points to the correct address
* **Missing service data**: Ensure `enable_metrics=True` is set in `PipelineParams`
* **Connection errors**: Check that the MLflow server is accessible from your application and the endpoint URL is correct
* **Wrong experiment**: Set the `x-mlflow-experiment-id` header to direct traces to the correct experiment
## References
* [MLflow Tracing Documentation](https://mlflow.org/docs/latest/genai/tracing/)
* [MLflow OpenTelemetry Integration](https://mlflow.org/docs/latest/genai/tracing/app-instrumentation/opentelemetry.html)
* [MLflow Pipecat Integration Guide](https://mlflow.org/docs/latest/genai/tracing/integrations/listing/pipecat.html)
* [Pipecat OpenTelemetry Tracing](/api-reference/server/utilities/opentelemetry)