

Overview
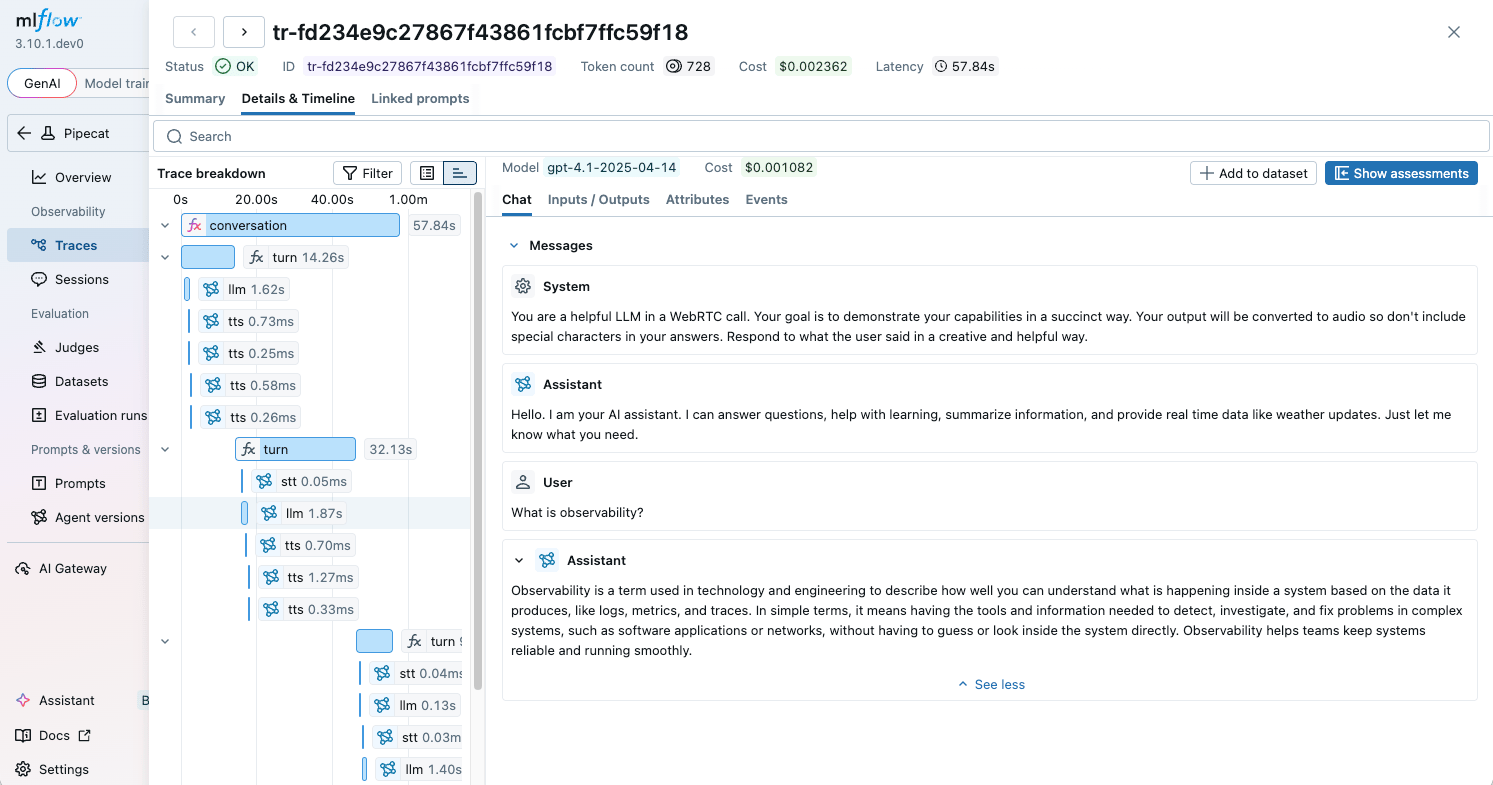
MLflow is an open-source platform for managing the end-to-end machine learning and AI lifecycle. MLflow Tracing provides detailed observability into AI agent execution, capturing LLM calls, tool usage, and agent decisions with a rich visualization UI. Since Pipecat’s built-in tracing uses OpenTelemetry, you can send traces directly to MLflow’s OTLP endpoint for visualization and analysis.MLflow Tracing Docs
Learn about MLflow’s tracing capabilities
MLflow Pipecat Integration
MLflow’s guide for tracing Pipecat applications
MLflow GitHub
Browse the MLflow open-source repository
MLflow Platform
Explore the MLflow platform
Installation
Install Pipecat with tracing support and the OTLP HTTP exporter:Prerequisites
Start MLflow
The quickest way to start the MLflow tracking server is withuvx (no installation needed):
Key Features
- Trace visualization: Inspect every LLM call, STT/TTS operation, and conversation turn in a hierarchical trace view
- Token usage tracking: Monitor input/output token counts across conversations
- Performance metrics: Track TTFB, processing duration, and latency for each service
- Evaluation framework: Evaluate agent outputs using built-in LLM judges and custom scorers
- Open source: Fully open-source with no vendor lock-in, self-host anywhere
Configuration
Configure the OTLP HTTP exporter to send traces to MLflow:x-mlflow-experiment-id header. The exporter
reads headers from OTEL_EXPORTER_OTLP_HEADERS, so set it in your environment,
along with the endpoint if it isn’t the default:
The
x-mlflow-experiment-id header specifies which MLflow experiment to log traces to. Use 0 for the default experiment, or create a dedicated experiment:Usage
Basic Setup
Troubleshooting
- No traces visible: Verify the MLflow server is running and the
OTEL_EXPORTER_OTLP_ENDPOINTpoints to the correct address - Missing service data: Ensure
enable_metrics=Trueis set inPipelineParams - Connection errors: Check that the MLflow server is accessible from your application and the endpoint URL is correct
- Wrong experiment: Set the
x-mlflow-experiment-idheader to direct traces to the correct experiment