

Overview
Roark is an end-to-end platform for testing and monitoring voice AI agents. It runs automated simulations against your Pipecat Cloud agent over the Daily transport, captures every production call, traces each turn end to end, and scores everything with the same library of metrics — so the behavior you test before shipping is the behavior you measure in production.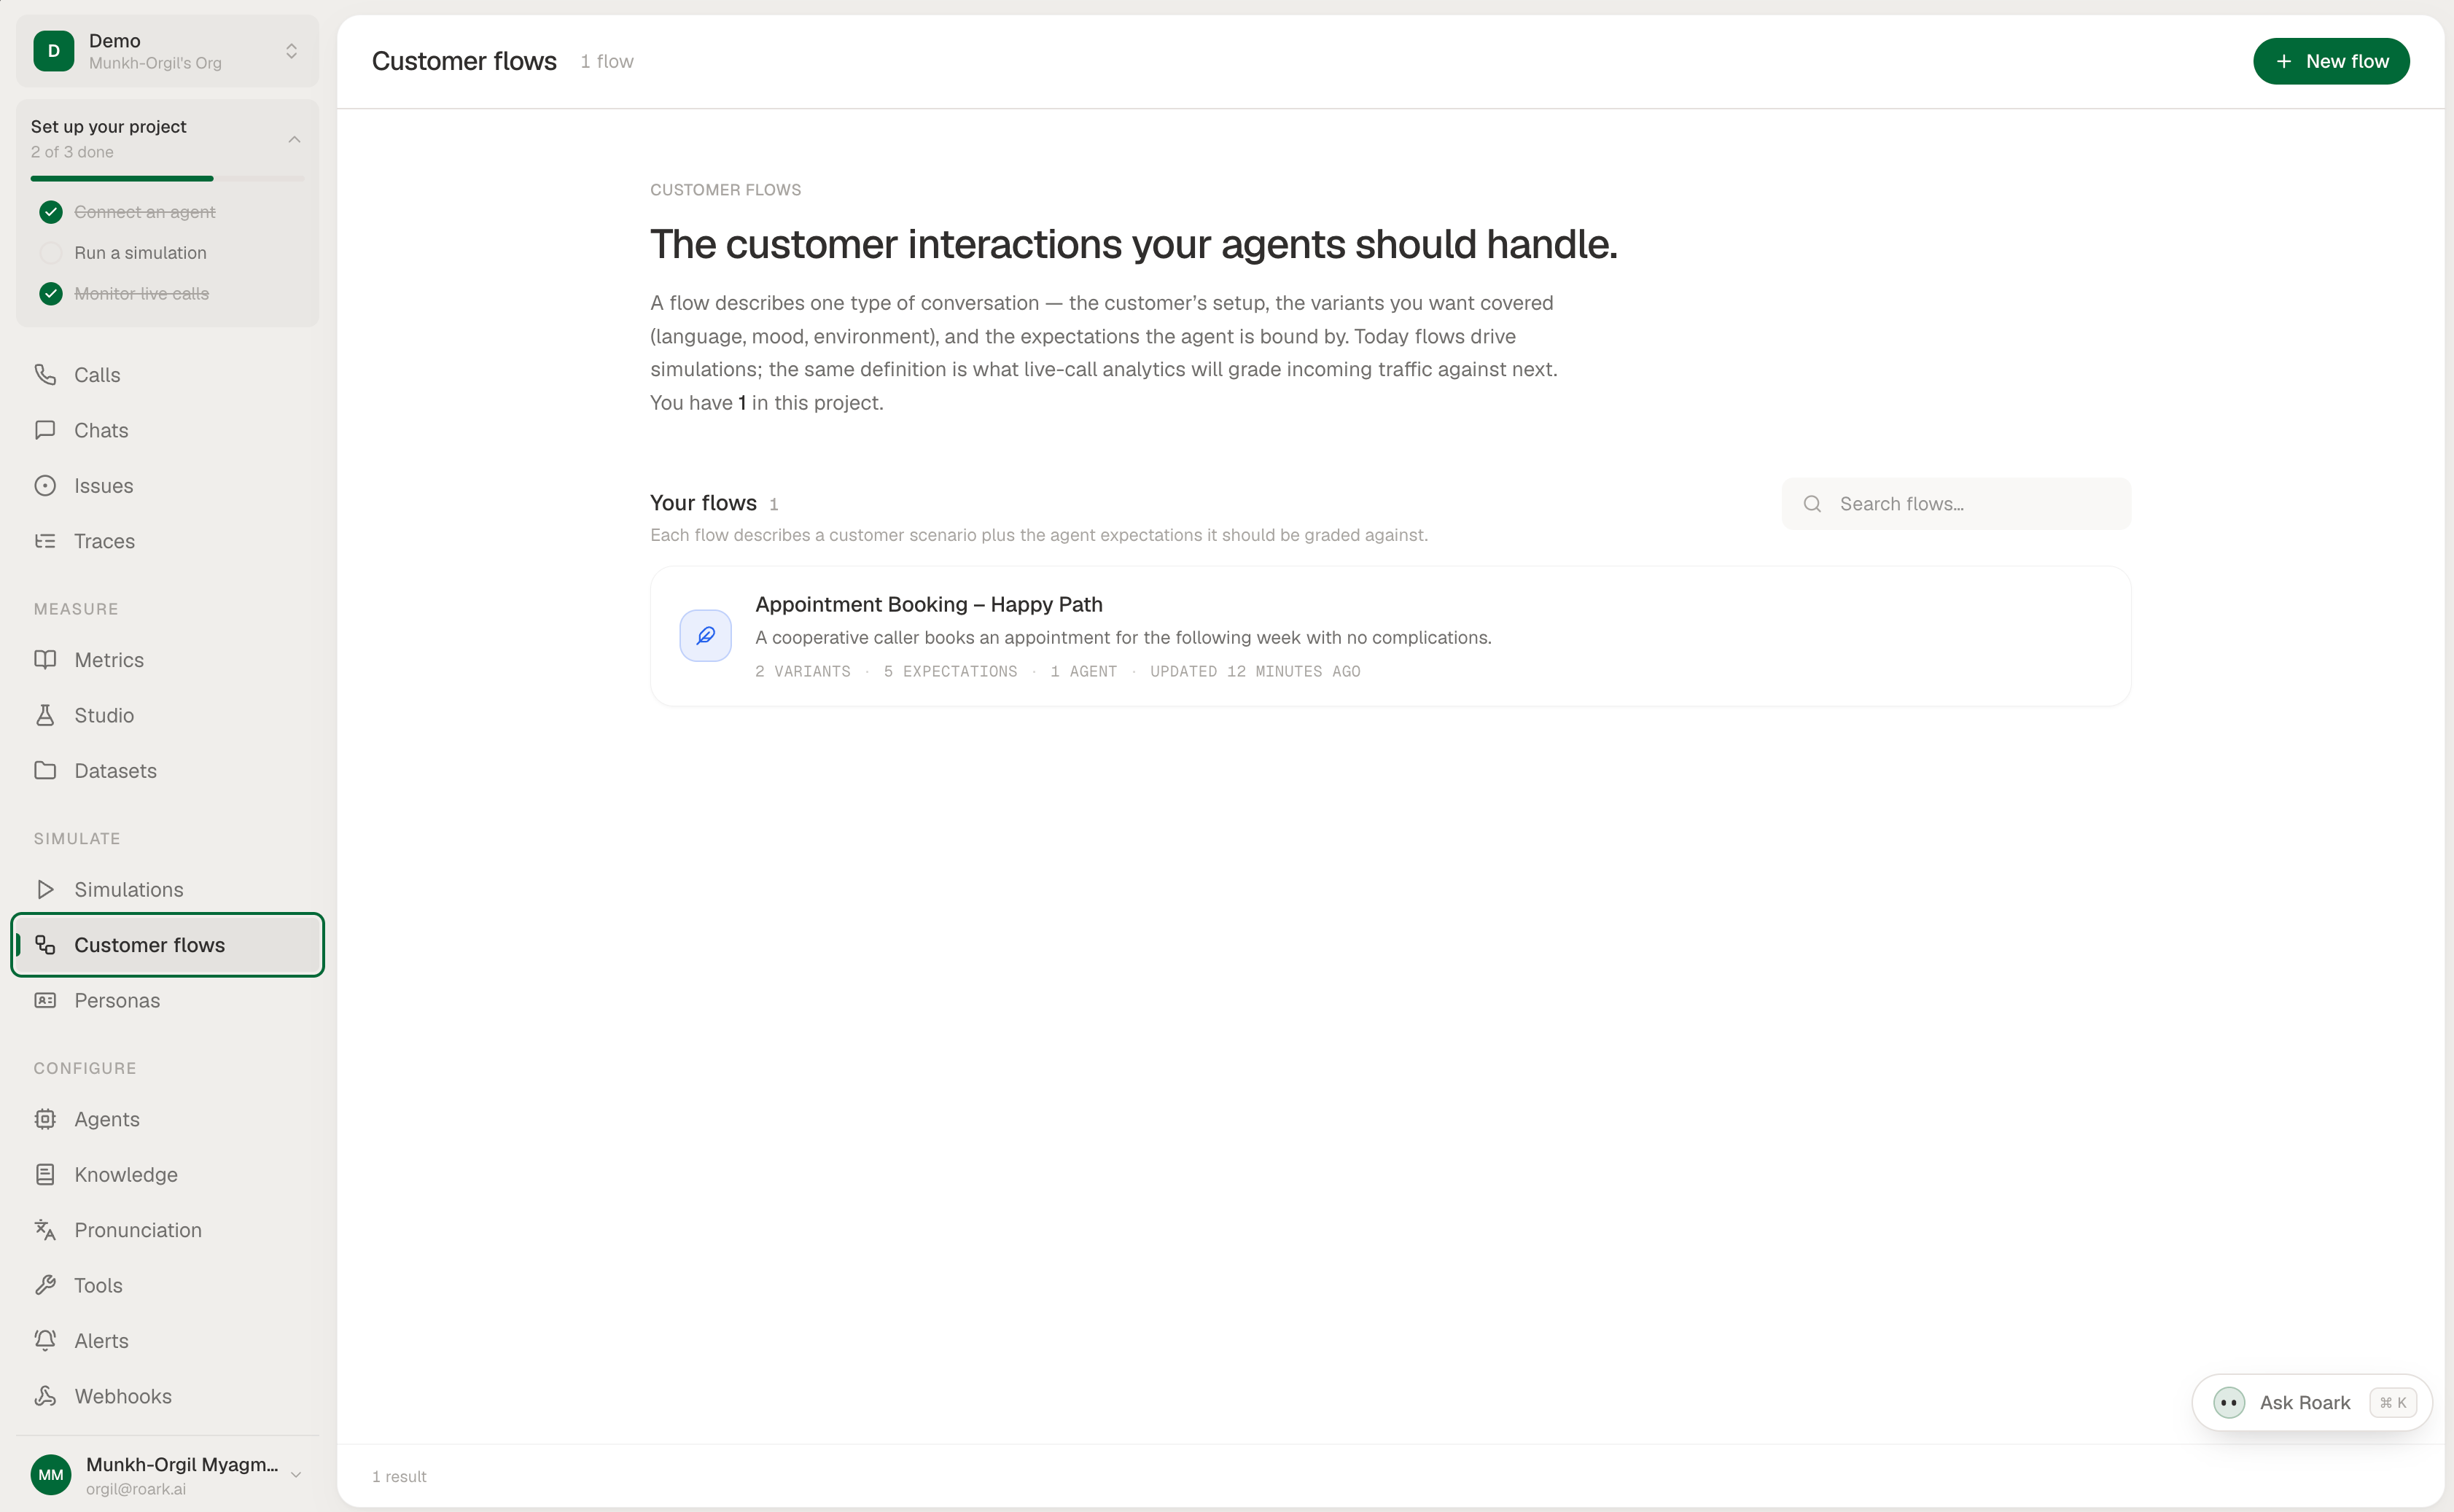
- Run automated simulations that call your agent over the Daily transport using lifelike personas and branching flows
- Score every call — simulated or live — against built-in metrics plus your own LLM-graded custom metrics
- Trace each turn (STT → LLM → TTS, tool calls, latency) via OpenTelemetry and inspect it on the call
- Monitor production traffic continuously and turn any real call into a repeatable regression test
How the integration works
Roark connects to Pipecat through a single observer, then layers testing and monitoring on top:-
Sync and capture with the observer. The
pipecat-roarkpackage adds aRoarkObserverto your pipeline. It registers (“syncs”) your agent to Roark the first time it runs, then streams every call’s transcript, tool calls, and a stereo recording to Roark. See the Roark analytics observer reference for full setup. - Simulate over the Daily transport. Once your Pipecat Cloud credentials are connected, Roark starts your agent on Pipecat Cloud, joins the Daily room as a simulated caller, drives your flow with a chosen persona, and collects the transcript, recording, traces, and metrics automatically — no code changes beyond the observer.
Getting started
1
Create a Roark account and API key
Sign up at roark.ai and create an API key on the API
keys page in your project. You’ll pass it as
api_key in the steps below.2
Install the observer and sync your agent
Add the
pipecat-roark package and
drop RoarkObserver into your pipeline. The first call registers your agent
with Roark automatically, so it appears under the Pipecat source filter and
becomes available for simulations and reports.3
Connect your Pipecat Cloud credentials
In the Roark dashboard, create a Pipecat integration and enter your
Pipecat Cloud API key and the Pipecat agent name (the name of your
deployed Pipecat Cloud agent — this is what Roark starts for each run,
distinct from the Roark agent name you set on the observer). Roark uses
these to start your agent and target it for simulation runs.
4
Build a run plan and simulate
Assemble a run plan — a test matrix of flows, personas, and metrics — then
run it from the dashboard or on a schedule. Roark provisions each simulation
automatically and handles session creation, execution, and cleanup for every
run.
Simulations
When you start a run, Roark starts your agent on Pipecat Cloud, which boots it into a Daily room, and Roark joins that room as a simulated caller over the Daily transport. Because Pipecat Cloud returns the room URL and token up front, Roark connects without any SDP handshake and manages the full session lifecycle for you. A run is defined by a run plan — a test matrix of flows × personas × metrics. You can run 1–100 iterations per test case, run on a schedule, and compare runs over time to catch regressions.Personas
Personas are the simulated callers that drive each conversation — configurable characters that let you test how your agent handles a realistic range of real-world callers, not just the happy path:- Voice: language and accent (US, British, Indian, and more), gender, and optional background noise (e.g. office)
- Speech: pace, clarity (clear, vague, rambling), and natural disfluencies like “um” and “uh”
- Behavior: base emotion (neutral, cheerful, confused, frustrated, skeptical, rushed), intent clarity, confirmation style, and memory reliability
- Context: an optional backstory and custom key-value properties (account number, membership status, and so on)
Flows
A flow defines the conversation path a simulation follows — what the caller says, how the agent is expected to respond, and where the conversation can branch. Flows come in two modes:- Scripted — a visual graph of nodes and edges that lays out an exact path. Nodes cover customer turns, agent turns, silence, DTMF keypad input, and voicemail; edges let the conversation branch or loop back, so one flow can cover many outcomes.
- Improv — a plain-language brief the simulated caller improvises from, for open-ended conversations you don’t want to script turn by turn.
- Generate from your agent prompt — Roark drafts flows from a description of what your agent does
- Generate from a real call — turn a production conversation into a repeatable flow
- Build it yourself — lay out the graph (scripted) or write the brief (improv) in the visual editor
Metrics
Every call — simulated or live — is scored against the same metric library, so a fix you verify in simulation is measured the same way in production.- Built-in metrics are collected automatically with no configuration, spanning latency and response time, interruptions and overlap, sentiment and emotion, speech quality (DNSMOS), and compliance checks like PII handling and prompt-injection resistance.
- Custom metrics are defined in natural language and graded by Roark Prism, Roark’s model built for scoring voice conversations — for example identity verification (boolean), empathy (scale), call reason (classification), or upsell attempts (count).
- Thresholds turn any metric into a pass/fail outcome (e.g.
Response Time < 1000ms), applied per call or aggregated across a run.
Because simulations use the same
RoarkObserver capture path as production
calls, the two are scored identically — making it straightforward to reproduce
a production issue as a repeatable, metric-gated test.Tracing
Roark ingests OpenTelemetry traces from Pipecat’s built-in tracing, so each call’s full turn tree — STT, LLM, TTS, and tool calls, with latency at every span — shows up on the Tracing tab of the call. Configure the tracer provider before constructingPipelineWorker (Pipecat grabs the provider at task-init time), and pass the same call ID to both RoarkObserver(pipecat_call_id=...) and PipelineWorker(conversation_id=...) so Roark can link the trace to the call.
Observability
Simulations cover pre-deployment testing; theRoarkObserver keeps that coverage running against real traffic. Because the observer is already in your pipeline, every production call flows to Roark automatically — transcript, tool calls, stereo recording, traces, and metrics — with no extra wiring. Watch calls live, track metrics over time on dashboards, and turn any interesting production call into a new flow so the same case is covered in your next run.
See the Roark analytics observer reference for capture details and configuration.
Next steps
Roark Documentation
Full setup guides, API reference, and configuration options.
Pipecat Integration Guide
Step-by-step guide for connecting Roark to your Pipecat agent.
Simulation Testing
Personas, flows, run plans, and how simulations execute.
Roark Analytics Observer
The
RoarkObserver reference for capturing production calls.